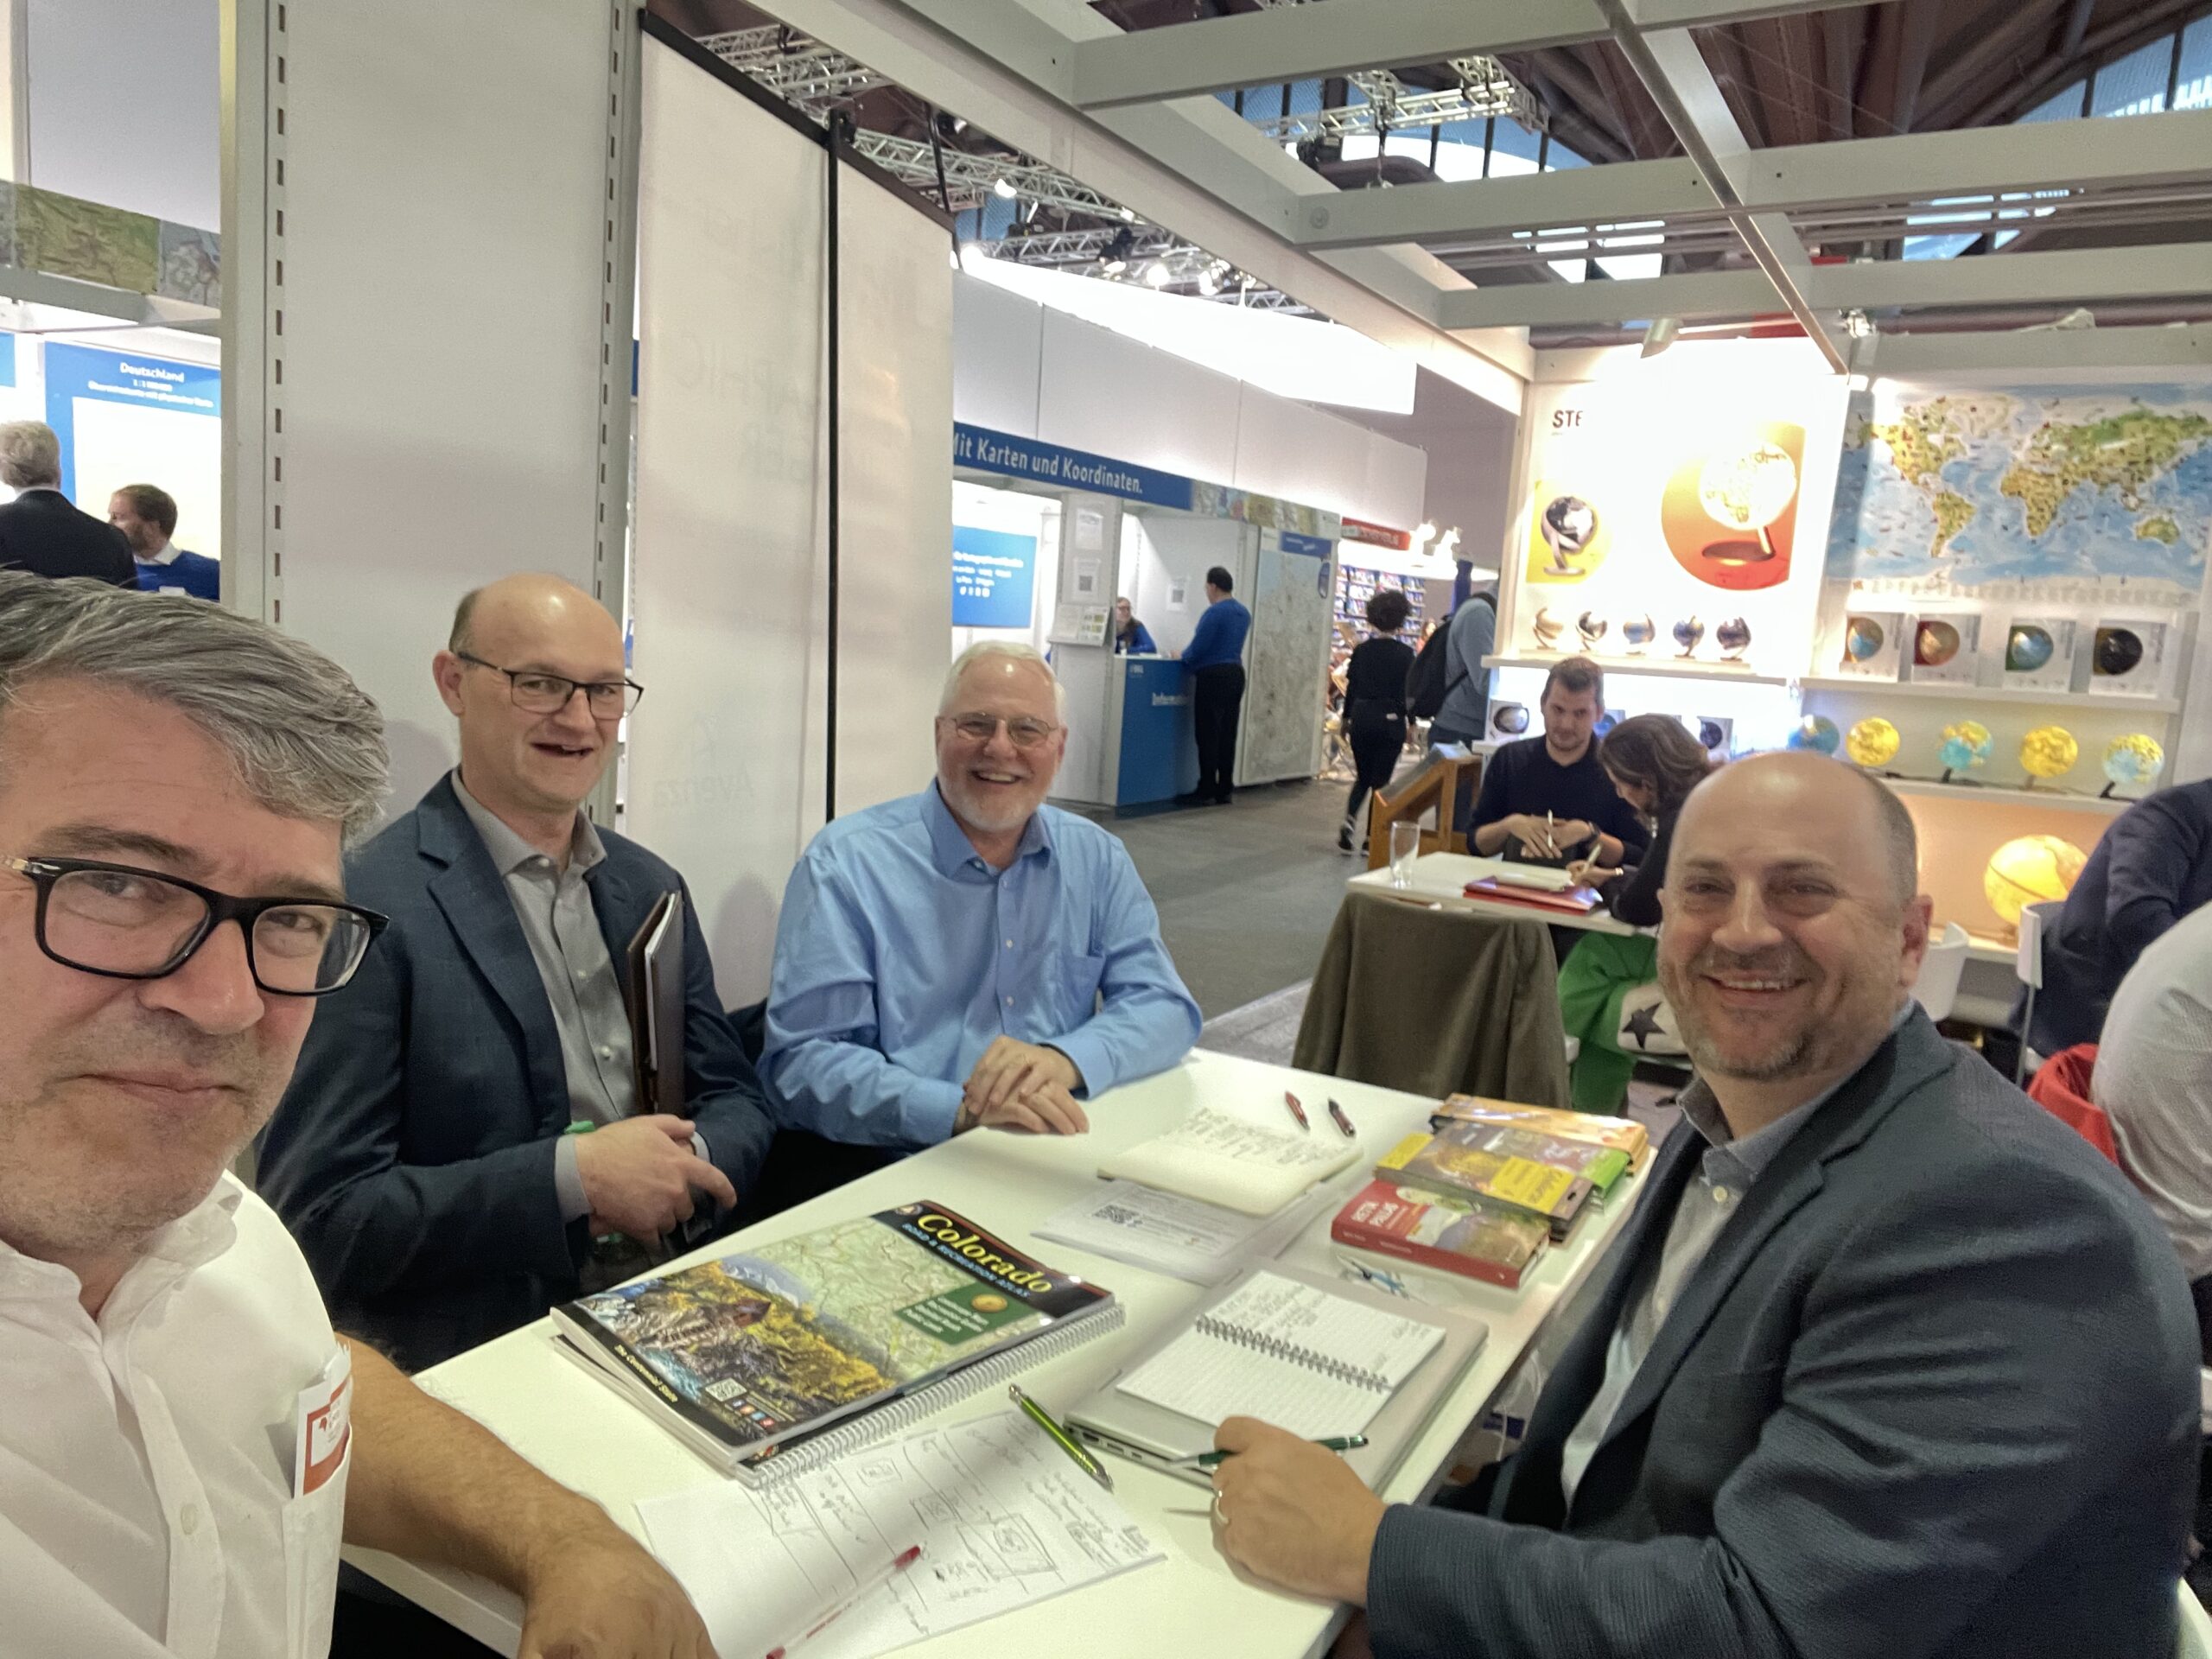
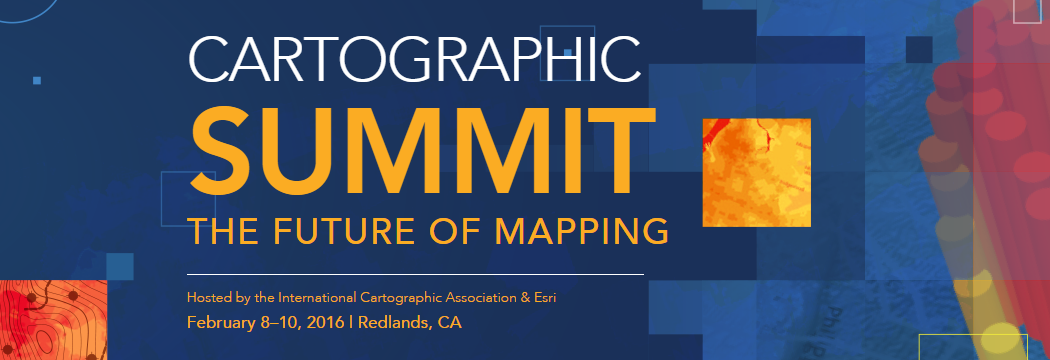
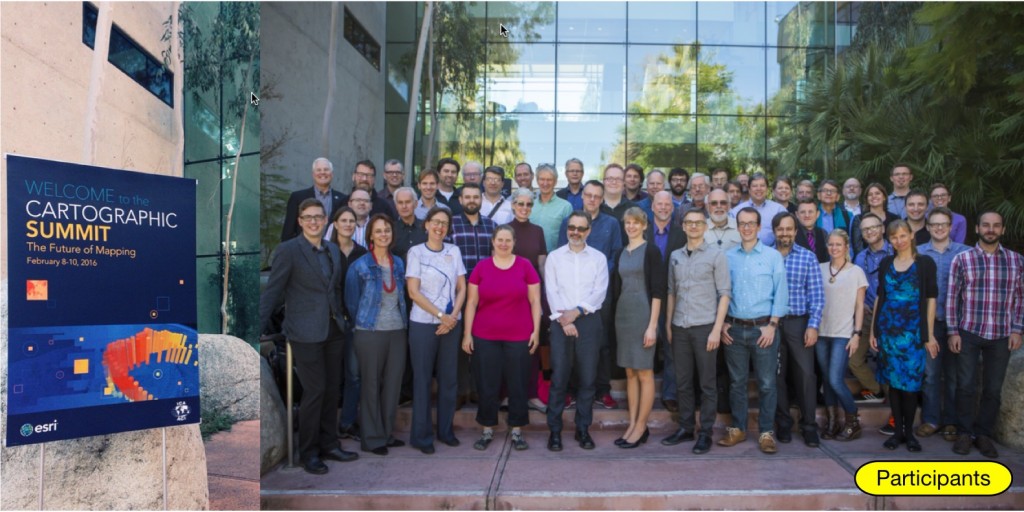
The International Cartographic Association (ICA) and Esri hosted a Cartographic Summit, 8–10 February 2016 in Redlands, California. This summit of invite-only guests from a broad array of fields assessed the state of play in mapping and visualization and explored where we’re headed. Leading thinkers from academia, government and industry explored trends and how they are shaping the work that we’re doing.
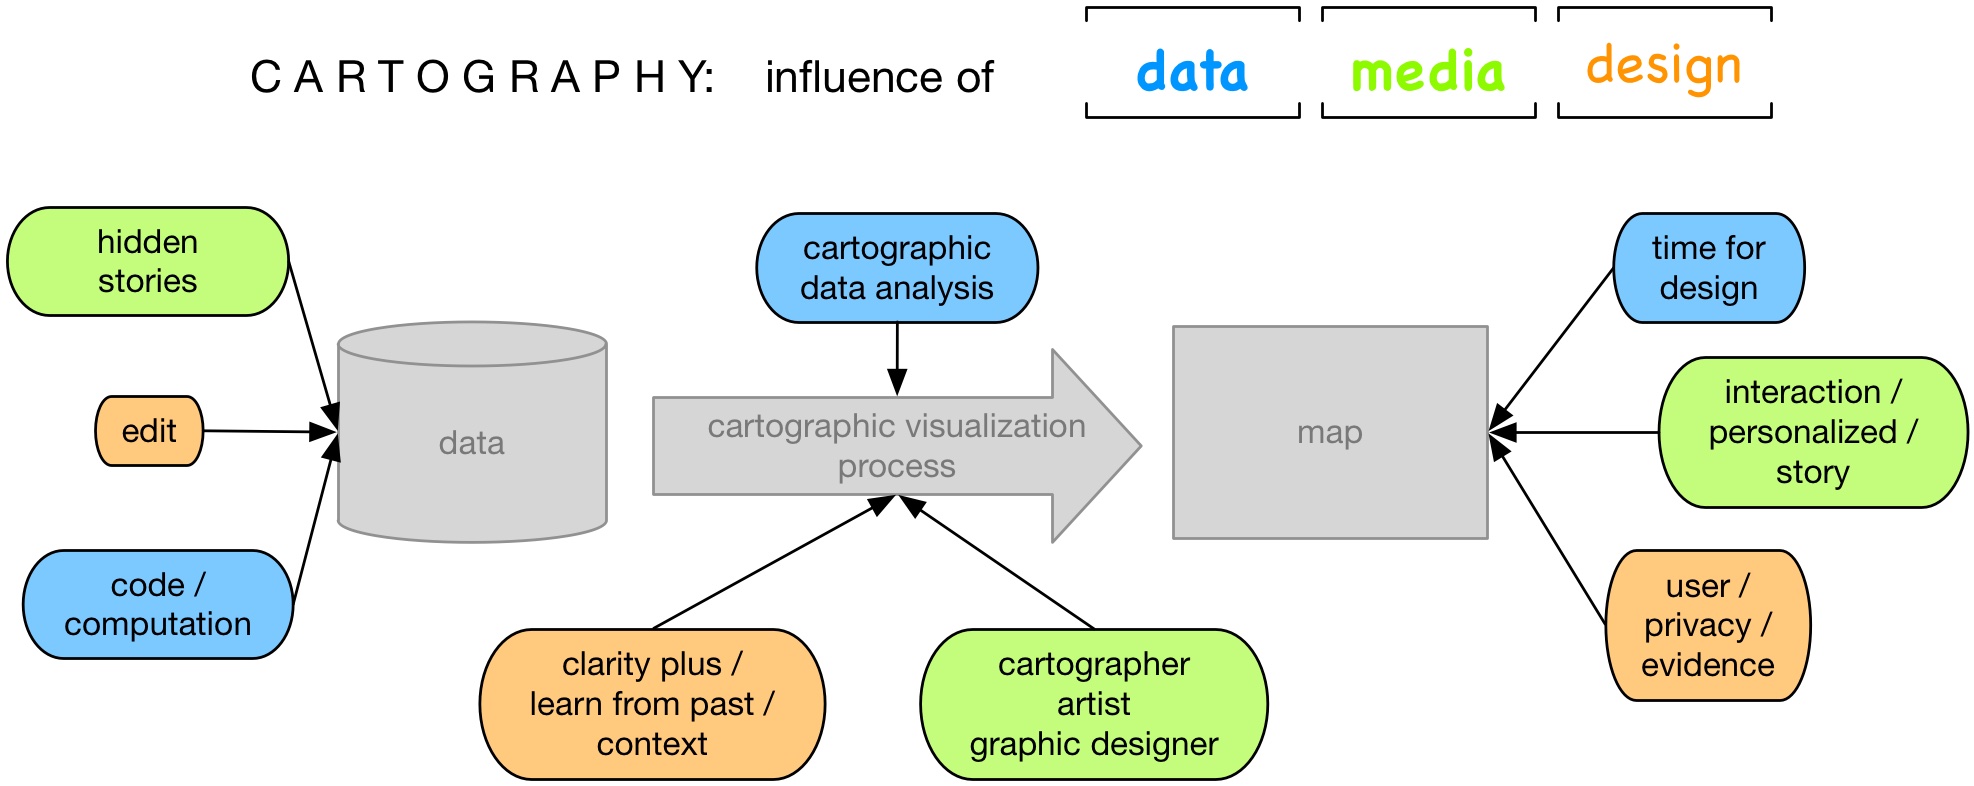
Broad themes of Data, Media, and Design provided a focus for open sharing and conversation to learn from each other, and share best practices, and find new or proposed solutions.
The summit intended draw together a plan for research, innovation and strategic thinking to support mapping and visualization needs as we move forward. The intent was to set a marker for understanding common challenges from a range of perspectives in and outside the traditional cartographic communities; to draw together different ways of thinking and working; and to build bridges across the many communities in the map-making and visualization fields.

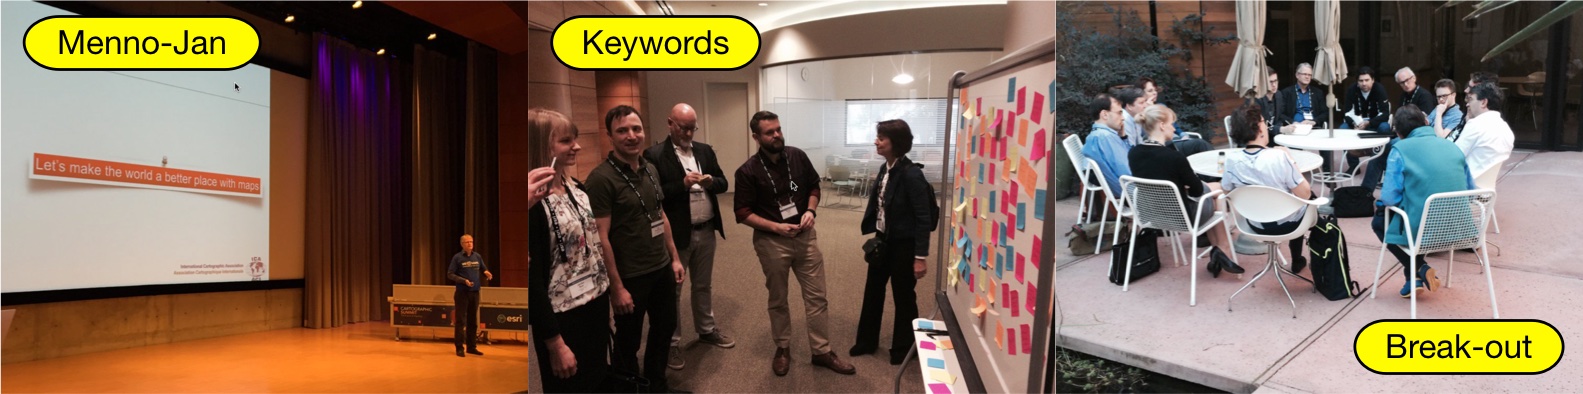
For each of the three topic half a day was reserved, and consisted of three speakers (a keynote and two lightning talks) and breakout sessions to discuss the topic based on the top five keywords generate by the audience after the talks. The findings of the four groups were reported after each session. In a final session an overall discussion was followed by a synthesis of the lessons learned.
Program
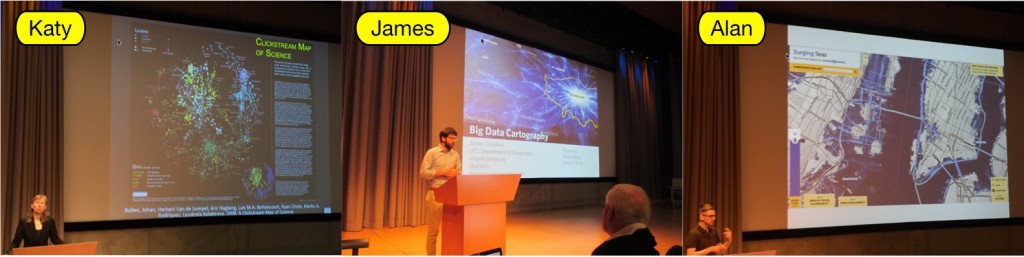
Data
- Keynote: Improving Data Visualization Literacy: How to Empower Anyone to Read and Make Visualizations – Katy Börner, Victor H. Yngve Professor of Information Science, Indiana University
- Lightning Talk: Big Data Cartography – James Cheshire, Lecturer in Quantitative Human Geography, University College London
- Lightning Talk: Doing Cartography as Professional Amateurs – Alan McConchie, Lead Cartographer, Stamen Design
Keywords for the topic of data: data design, data analysis, domain expertise, user and applications, conceptualization
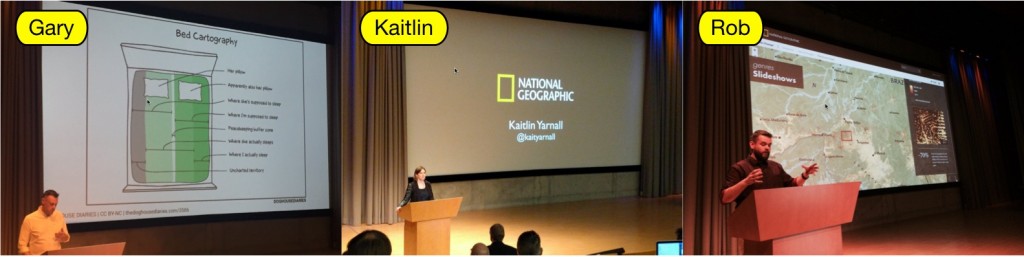
Media
- Keynote: carto-future-ography – Gary Gale, CTO, what3words
- Lightning Talk: Mapping for new media. Building on 128 years at National Geographic. – Kaitlin Yarnall, Director of Maps, Graphics, and Art, National Geographic
- Lightning Talk: Cartographic Design as Visual Storytelling – Robert Roth, Director, University of Wisconsin Cartography Laboratory Assistant Professor, UW-Madison Department of Geography
Keywords for the topic of media: storytelling, technology to create interaction; ethics, tracking; purpose of map; user, human make and using the maps
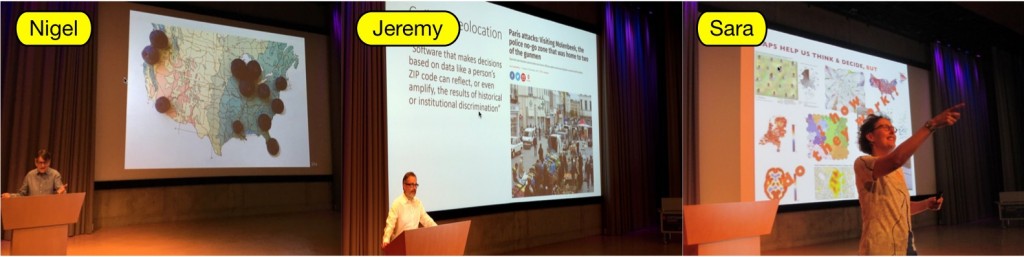
Design
- Keynote: Pictures and Geography – Nigel Holmes, Graphic Designer, Explanation Graphics
- Lightning Talk: Geoprivacy in the Age of Big Data – Jeremy W. Crampton, Associate Professor of Geography, University of Kentucky
- Lightning Talk: Evidence Based Design – Sara Irina Fabrikant, Professor, Department of Geography, University of Zurich
Keywords for the topic of design: clarity, user/audience, privacy, uncertainty, issues of design for big data
Synthesis
- Synthesis: ICA Viewpoint & Lessons Learned – Menno-Jan Kraak, ICA president, Professor of Geovisual Analytics and Cartography, University of Twente / ITC
The third day was a view into the ESRI Kitchen. The participants were able to comment on planned developments related to topics such as Mapping and Visualization, 3D and Story Mapping as well as a few other topics, while discussing with ESRI developers.
Results
How the audience reacted to the summit can be found on Twitter via #cartosummit
The results of the discussions is summarized in the figure below. An more extensive interpretation will follow in a contribution to our International Journal of Cartography.

Follow-up
- Further elaboration of the materials into a column for ESRI news.
- The recordings of the event will be shared and disseminated widely (links via our website).
- Convert this report into an ICA News article.
- Elaborate into a paper for our International Journal of Cartography.