


At the 25th International Cartography Conference in Paris, France, the “World Bank eAtlas of Global Development” won the first jury’s prize in the category Educational Cartographic Resources. The jury stated:
Interactive website with a variety of functionalities to visualize and compare progress on the most important development challenges facing our world.

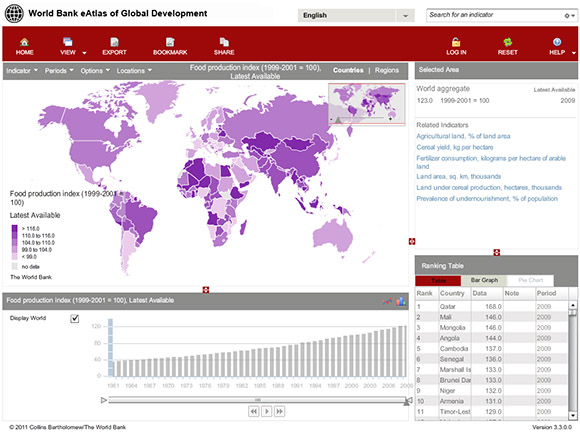
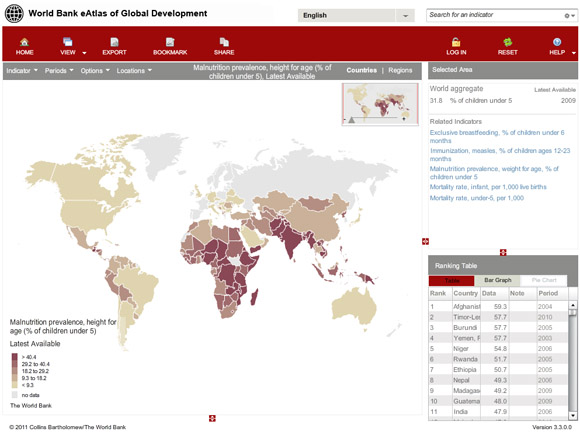
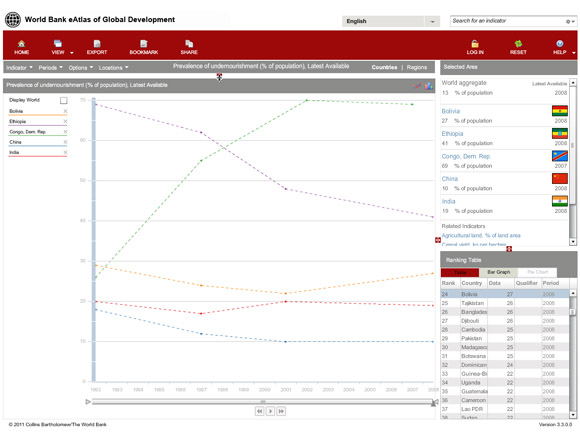


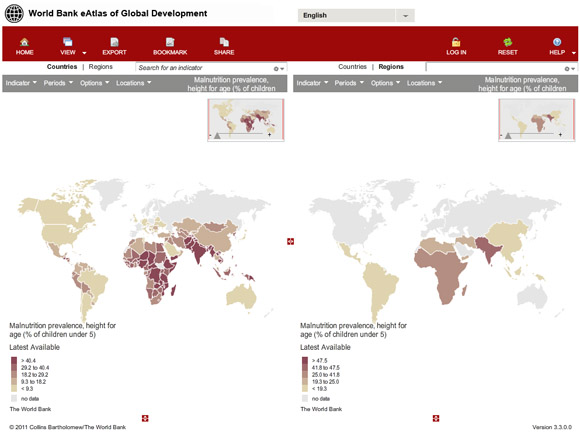
Publisher’s Description: The World Bank eAtlas of Global Development maps and graphs 179 thematically organized indicators for over 200 countries, letting you visualize and compare progress on the most important development challenges facing our world. Most indicators cover several decades, so you can see, for example, how “life expectancy at birth” has improved from 1960 up through the latest year. The 25 themes organize the indicators from World Bank’s development database, allowing you to explore such issues as How Poor is Poor?, Children at Work, Energy Security and Climate Change, and Improving the Health of Mothers.
When an indicator is selected, a world map appears, showing the latest data for more than 200 economies. With the eAtlas, you can:
- Map indicators by the latest available data or in a given year, with panning and zooming capabilities
- Create time series graphs for specific countries
- Read descriptions of the thematic groupings
- Find an indicator by keyword search, dropdown menu, or through related themes
- Compare and view two maps or graphs simultaneously
- Animate a map to show change over time
- View data in ranking order table or bar graph alongside the map
- Alter map colors, data intervals, and year.
- Bookmark and share your map with other users
- Export map image and data for use in presentations and more
- Import your own data
This eAtlas is part of a suite of user-friendly, data visualization tools that also includes:
- World Bank eAtlas of Financial Inclusion
- World Bank eAtlas of Gender
- World Bank eAtlas of the Millennium Development Goals
